Football Analytics with Python & R - Chapter 5
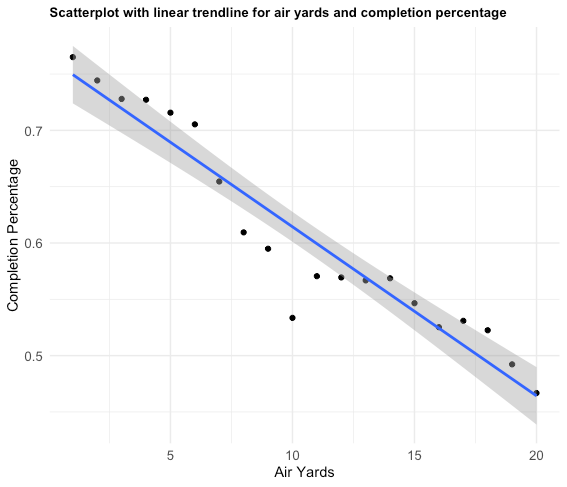
In Chapter 5, we're evaluating quarterback accuracy. The plot below shows the completion percentage of all passes (y-axis) and the air yards (x-axis) from 2016 - 2023. We can see that there is a relation between the likelihood of a pass being completed based on how many yards in the air the ball travels. As expected, longer passes have a lower completion percentage.
In recent years however, the analytics community has developed an even more robust metric for evaluating quarterback accuracy - completion percentage over expected also known as CPOE. The concept of Generalized Linear Models (GLM) is introduced in this chapter - GLMs are defined as a class of regression models that exist to model outcomes that are inappropriate for linear or multiple regression. GLMs generalize, or extend, linear models to allow for response variables that are assumed to come from a non-normal distribution.
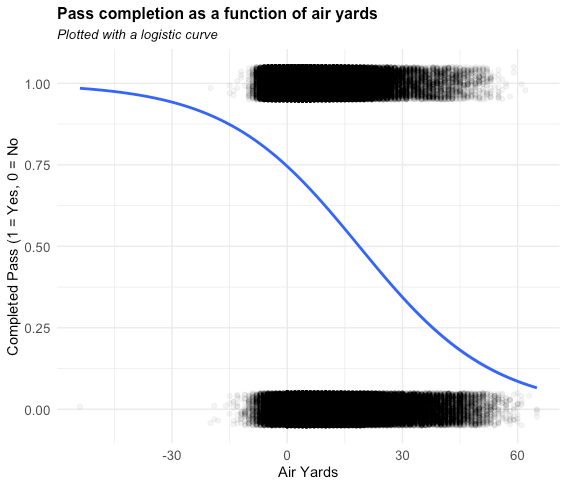
The plot below leverages a logistic line (the curved line) to show any trends in the data - this is necessary because of the large number of overlapping points. As we can see (similar to the linear trendline above), as air yards increase so too does the number of incomplete passes.
Now, we haven't really explored the CPOE metric yet so let's start getting into that.
# A tibble: 348 × 6
   season passer_id  passer            n   cpoe compl
    <int> <chr>      <chr>         <int>  <dbl> <dbl>
 1   2019 00-0020531 D.Brees         406 0.0938 0.756
 2   2018 00-0020531 D.Brees         566 0.0862 0.739
 3   2020 00-0033537 D.Watson        542 0.0732 0.705
 4   2020 00-0033357 T.Hill          121 0.0723 0.727
 5   2016 00-0026143 M.Ryan          631 0.0687 0.702
 6   2019 00-0029701 R.Tannehill     343 0.0686 0.691
 7   2020 00-0023459 A.Rodgers       607 0.0615 0.705
 8   2023 00-0037834 B.Purdy         441 0.0592 0.698
 9   2017 00-0020531 D.Brees         606 0.0590 0.716
10   2018 00-0026143 M.Ryan          607 0.0587 0.695
11   2021 00-0036442 J.Burrow        659 0.0561 0.703
12   2023 00-0033319 N.Mullens       147 0.0558 0.680
13   2016 00-0020531 D.Brees         664 0.0546 0.708
14   2018 00-0032950 C.Wentz         399 0.0544 0.699
15   2018 00-0023682 R.Fitzpatrick   246 0.0539 0.667
16   2022 00-0030565 G.Smith         605 0.0537 0.701
17   2016 00-0027854 S.Bradford      551 0.0527 0.717
18   2018 00-0029604 K.Cousins       603 0.0522 0.705
19   2017 00-0031345 J.Garoppolo     176 0.0491 0.682
20   2022 00-0031503 J.Winston       113 0.0485 0.646
The data above shows the top 20 CPOE leaders from 2016 - 2023. However, pass depth is not the only variable that matters in terms of completion percentage. So to examine how additional features might effect the results, let's add down, distance to go for a first down, distance to go to the end zone, pass location, and whether the quarterback was hit on the play to the model. Resulting in:
# A tibble: 348 × 7
   season passer_id  passer            n   cpoe compl exp_completion
    <int> <chr>      <chr>         <int>  <dbl> <dbl>          <dbl>
 1   2018 00-0020531 D.Brees         566 0.0883 0.739          0.650
 2   2019 00-0020531 D.Brees         406 0.0875 0.756          0.669
 3   2020 00-0033357 T.Hill          121 0.0825 0.727          0.645
 4   2023 00-0033319 N.Mullens       147 0.0802 0.680          0.600
 5   2016 00-0026143 M.Ryan          631 0.0772 0.702          0.625
 6   2020 00-0033537 D.Watson        542 0.0723 0.705          0.632
 7   2023 00-0029604 K.Cousins       309 0.0684 0.699          0.631
 8   2019 00-0029701 R.Tannehill     343 0.0663 0.691          0.625
 9   2016 00-0027854 S.Bradford      551 0.0611 0.717          0.656
10   2018 00-0023682 R.Fitzpatrick   246 0.0611 0.667          0.606
11   2020 00-0023459 A.Rodgers       607 0.0606 0.705          0.644
12   2018 00-0026143 M.Ryan          607 0.0593 0.695          0.636
13   2023 00-0037834 B.Purdy         441 0.0580 0.698          0.640
14   2018 00-0032950 C.Wentz         399 0.0578 0.699          0.641
15   2017 00-0020531 D.Brees         606 0.0569 0.716          0.659
16   2023 00-0033077 D.Prescott      650 0.0561 0.694          0.638
17   2021 00-0036442 J.Burrow        659 0.0555 0.703          0.647
18   2016 00-0025708 M.Moore         122 0.0551 0.689          0.633
19   2022 00-0030565 G.Smith         605 0.0547 0.701          0.646
20   2021 00-0023459 A.Rodgers       556 0.0543 0.694          0.640
Here we can see that Drew Brees is still on top but his 2018 jumps to #1 along with a few other changes. Interestingly enough, the 2023 EPA God, Brock Purdy, falls several places when we add the additional variables to our model. 2023 regular season MVP candidate, Dak Prescott, didn't even crack the top 20 in our first model but shows up as #16 with the additional variables.
When it comes to evaluating whether or not CPOE is a valuable metric we'll need to determine if it is a more stable measure than simple completion percentage. By calculating the lag between the current CPOE and previous year's CPOE we can find out the truth of the matter.
Spoiler alert: CPOE is sightly more stable than completion percentage which makes CPOE a slightly improved metric.
Exercises
- Repeat this analysis without quarterback hits as one of the features. How does it change the leaderboard? What can you take from this?
After removing quarterback hits from the model Drew Brees still holds the top two positions and even sees an increase in CPOE for both seasons. We also see Deshaun Watson and Aaron Rodgers' 2020 seasons move them into the top 5. We see some other big moves such as Dak Prescott's 2023 campaign catapulting him from #16 to #9. This suggests that players like Brees, Watson, Rodgers, and Prescott are significantly more accurate when they are not pressured. It's worth noting that defensive linemen and linebackers are the most common defenders who rush the quarterback (defenders who are typically enormous human beings). This may give us some signal as to why Brees, an undersized quarterback, was more accurate with qb hits removed. Interestingly enough, some players like Matt Ryan (2016 & 2018) actually saw their CPOE decrease when quarterback hits were removed. This suggests that some quarterbacks might have a better ability to "hang in the pocket" under duress whereas other, more mobile quarterbacks (like Rodgers and Watson), are more prone to trying to make plays on the run when under pressure - resulting in attempting higher level of difficulty passes more often. Overall, it seems that the inclusion or exclusion of quarterback hits in the CPOE metric largely points to the fact that this is something that depends a lot on the quarterback himself and his particular style of play, mobility, and/or size.
season passer_id  passer        n   cpoe compl exp_completion
    <int> <chr>      <chr>     <int>  <dbl> <dbl>          <dbl>
 1   2018 00-0020531 D.Brees     566 0.0934 0.739          0.645
 2   2019 00-0020531 D.Brees     406 0.0931 0.756          0.663
 3   2020 00-0033357 T.Hill      121 0.0788 0.727          0.648
 4   2020 00-0033537 D.Watson    542 0.0738 0.705          0.631
 5   2020 00-0023459 A.Rodgers   607 0.0693 0.705          0.636
 6   2019 00-0029701 R.Tanneh…   343 0.0675 0.691          0.623
 7   2016 00-0026143 M.Ryan      631 0.0675 0.702          0.635
 8   2017 00-0020531 D.Brees     606 0.0612 0.716          0.655
 9   2023 00-0033077 D.Presco…   650 0.0580 0.694          0.636
10   2016 00-0020531 D.Brees     661 0.0580 0.711          0.653
11   2021 00-0023459 A.Rodgers   556 0.0576 0.694          0.637
12   2016 00-0027854 S.Bradfo…   551 0.0570 0.717          0.660
13   2017 00-0031345 J.Garopp…   176 0.0566 0.682          0.625
14   2023 00-0037834 B.Purdy     441 0.0563 0.698          0.642
15   2018 00-0026143 M.Ryan      607 0.0556 0.695          0.640
16   2021 00-0036442 J.Burrow    659 0.0552 0.703          0.647
17   2018 00-0032950 C.Wentz     399 0.0547 0.699          0.645
18   2023 00-0033319 N.Mullens   147 0.0539 0.680          0.626
19   2023 00-0029604 K.Cousins   309 0.0537 0.699          0.645
20   2018 00-0029604 K.Cousins   603 0.0522 0.705          0.653
Top 20 quarterbacks by CPOE with quarterback hits removed from the model
- What other features could be added to the logistic regression? How does it affect the stability results in this chapter?
My first inclination was to add additional passing features to the regression such as quarterback scrambles in lieu of quarterback hits. However, swapping these features resulted in a lower stability of the metric. Including both qb scrambles and qb hits saw a very, very slight increase in stability to the metric. Generally speaking, it seems qb scrambles do not add much to the stability of the results. Next, I thought about how weather conditions can impact quarterback play so I added wind and temperature to the model. This resulted in a lower completion percentage and CPOE but the stability results were interesting. With the below features selected (variables inside the line starting with glm):
complete_more <- pbp_pass_no_miss %>%
  glm(formula = complete_pass ~ down * ydstogo + yardline_100 + air_yards + pass_location + wind + temp + qb_hit,
      family = "binomial")
adding weather conditions resulted in an increase of 0.048 in stability from completion percentage to CPOE - that's almost a 5% increase!