Basic Bar Chart in R

Getting started with my project I've decided to use R because of my familiarity with the language albeit, I still consider myself a beginner. In my experience, learning how to play around with the data has really helped me get comfortable with R. My most commonly used functions are:
filter(), group_by(), select(), mutate(), summarize()There are plenty of great resources available that already outline what these functions do and how to use them. I recommend R for Data Science by Hadley Wickham - this is pretty much the gold standard for getting up to speed with R.
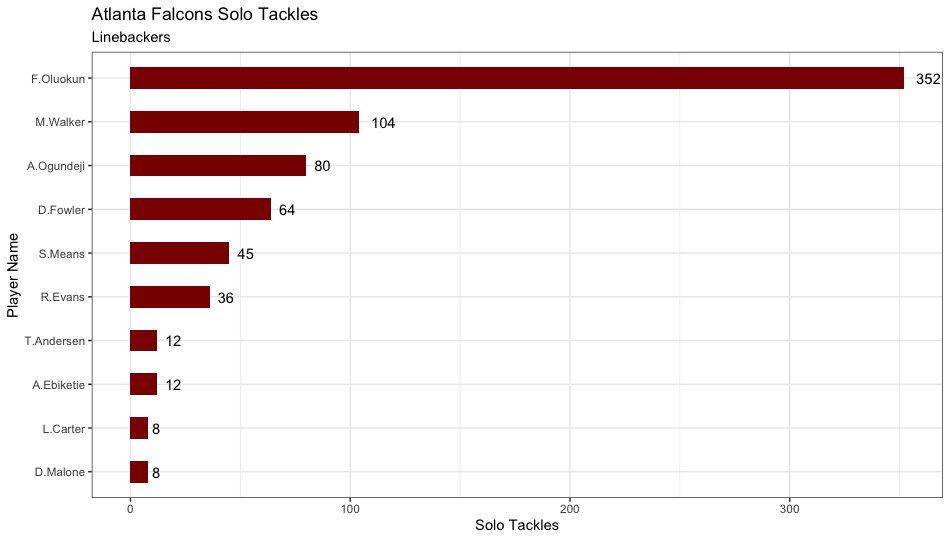
Today, I was playing around with player data for the 2021 and 2022 season and wrote some code that allowed us to examine solo tackles for the Atlanta Falcons. This is some code that might be useful for someone who is just getting started with R - if your head is spinning don't worry. Just keep pushing through and things will start to click!
Code
First, we need to load the necessary packages and data that we will be exploring. We load our play-by-play by calling the function 'load_pbp' and we enter the seasons that we want to pull. In our case, we're only interested in the 2021 and 2022 seasons so we store the data in the object 'pbp' with the following code:
pbp <- load_pbp(2021:2022)Next, we load the depth chart data and store the data in an object we will call depth. We also need to use the mutate function to change the column name 'gsis_id' to 'solo_tackle_1_player_id'. The reason we do this is because we will need to combine our pbp data with our depth chart data - 'solo_tackle_1_player_id' is the unique identifying column that we will combine things by.
# Load depth chart data for 2022 season and create new column
depth <- nflreadr::load_depth_charts(2022)

depth <- depth %>%
  mutate(solo_tackle_1_player_id = gsis_id)
Our next step is to filter the data so that results are only returned for the Atlanta Falcons. We create a new object called 'solo_tackle_atl' by using the filter function which removes any team that is not ATL. Then, we narrow the data down so that the only columns that populate are the 'solo_tackle_1_player_id', 'solo_tackle_1_player_name', and 'solo_tackle' by using the select function.
# Refine pbp data to display solo tackle totals for the Atlanta Falcons

solo_tackle_atl <- pbp %>% filter(solo_tackle_1_team == 'ATL') %>%
  select(solo_tackle_1_player_id, solo_tackle_1_player_name, solo_tackle)

solo_tackle_atl$club_code <- 'ATL'
The last thing we need to do is combine our 'solo_tackle_atl' and 'depth' dataframes - we will create a new object called 'depth_tackles' by using the left_join function.
# Combine depth and solo_tackle_atl into same dataframe

depth_tackles <- left_join(solo_tackle_atl, depth, by = "solo_tackle_1_player_id")
Now that our data has been combined, we need to make some final adjustments to the dataset. Remember, we want to plot the total amount of solo tackles made by players who play the Linebacker (LB) position.
We start with grouping the data by 'player_id' and 'player_name'. Then, we filter the data so that only players who are assigned the OLB, ILB, or LB position are returned. Next, we use mutate function in conjunction with case_when and grepl - this formats the data so that all players are listed with the position title LB.
Using the summarize function we create the column 'total_tackles' which equates to the sum of solo tackles made by a player. Finally, we ungroup the data and send it through ggplot.
# Generate bar plot to display total solo tackles for players at the Linebacker position

depth_tackles %>%
  group_by(solo_tackle_1_player_id, solo_tackle_1_player_name) %>%
  filter(position == 'OLB' | position == 'ILB' | position == 'LB') %>%
  mutate(position = case_when(grepl("OLB", position) ~ "LB", grepl("ILB", position) ~ "LB")) %>%
  summarize(total_tackles = sum(solo_tackle)) %>%
  ungroup() %>%
  ggplot(aes(reorder(solo_tackle_1_player_name, total_tackles), total_tackles)) +
  geom_bar(stat = "identity", fill = "darkred", width = 0.5) +
  geom_text(aes(label = total_tackles), hjust = -0.5) +
  coord_flip()+
  theme_bw()+
  ggtitle("Atlanta Falcons Solo Tackles",
          subtitle = "Linebackers") +
  labs(y = "Solo Tackles") +
  labs(x = "Player Name")
Results
If you want an easy way to reproduce this chart please feel free to reference the code here.